What are the key indicators of climate change, and how are they measured?
Climate change refers to significant, long-term changes in the temperature, precipitation, and other atmospheric conditions on Earth. The key indicators of climate change are critical measures that scientists use to track the changes in global climate systems and understand the potential impacts. These indicators include both direct measurements and proxy data (indirect evidence). Here's an overview of the key indicators and how they are measured:
1. Global Temperature Rise
Indicator:A consistent increase in Earth's average surface temperature is one of the most prominent and widely measured indicators of climate change.
How it’s measured:
Surface Temperature: This is typically measured using thermometers placed on land and sea surface stations around the world. Data is aggregated by organizations such as the National Aeronautics and Space Administration (NASA), the National Oceanic and Atmospheric Administration (NOAA), and the World Meteorological Organization (WMO).
Satellites:Satellites also measure temperature changes in the atmosphere, providing data on a broader scale.
Global Temperature Anomalies: This compares the temperature of a given year to a baseline average temperature, typically from a 30-year period.
2. Carbon Dioxide (CO₂) Concentrations
Indicator:The concentration of carbon dioxide, a greenhouse gas (GHG), in the atmosphere has risen significantly due to human activities such as burning fossil fuels, deforestation, and industrial processes.
How it’s measured:
Direct Atmospheric Measurement: CO₂ concentrations are monitored at various locations around the world. The most famous site is the Mauna Loa Observatory in Hawaii, where measurements have been taken since 1958.
Air Sampling and Analysis: CO₂ levels are measured using air sampling equipment that collects air samples at different altitudes and locations for analysis.
Satellite Observations: Satellites, such as NASA's OCO-2 (Orbiting Carbon Observatory), also monitor CO₂ concentrations globally.
3. Arctic and Antarctic Ice Mass Loss
Indicator:The shrinking of ice sheets and glaciers in the polar regions is a clear sign of global warming. This contributes to sea-level rise and indicates the warming of Earth's climate.
How it’s measured:
Satellite Observations: Satellites such as NASA's GRACE (Gravity Recovery and Climate Experiment) monitor ice mass loss by measuring changes in gravity as a result of melting ice.
Ground-based Surveys:Researchers conduct field studies and use ice cores to measure thickness and volume of glaciers in polar regions.
Aerial Surveys:Drones and airplanes equipped with LIDAR (Light Detection and Ranging)technology can also measure ice surface changes.
4. Sea Level Rise
Indicator:Rising sea levels are caused by the melting of ice sheets and glaciers and the thermal expansion of seawater as it warms.
How it’s measured:
Tide Gauges: Tide gauges placed at coastal stations measure the rise and fall of the sea level in relation to fixed land points.
Satellites:Satellites, such as NASA's TOPEX/Poseidon and Jason series, use radar altimetry to measure sea surface height over time. These satellites provide data with global coverage, enabling scientists to track sea level changes more accurately.
5. Ocean Warming
Indicator:The world's oceans are absorbing much of the excess heat caused by global warming. Ocean warming has a range of impacts, including the loss of marine life, coral bleaching, and changes in ocean circulation.
How it’s measured:
Ocean Buoys:Instrumented buoys placed in the ocean measure temperature at various depths. Organizations like the Argo program deploy thousands of floating buoys across the globe to collect temperature and salinity data.
Sea Surface Temperature (SST): SST data is collected from satellites and ships that measure the temperature of the ocean surface.
Temperature Probes:These are deployed at different ocean depths to monitor changes in heat content throughout the water column.
6. Ocean Acidification
Indicator:Increased CO₂ in the atmosphere is absorbed by oceans, leading to a decrease in pH, making the oceans more acidic. Ocean acidification affects marine ecosystems, particularly coral reefs and shellfish.
How it’s measured:
pH Sensors:Ocean researchers deploy sensors at various locations to measure the pH of ocean water. These sensors are often installed in buoys or research vessels.
Ocean Sampling:Researchers also collect water samples from various depths and locations for laboratory analysis to determine changes in acidity.
7. Extreme Weather Events
Indicator:An increase in the frequency and intensity of extreme weather events, such as heatwaves, storms, floods, and droughts, is linked to climate change. The warming atmosphere holds more moisture, leading to more intense storms and precipitation events.
How it’s measured:
Weather Stations:Meteorological stations around the world track extreme weather events and their frequency. These stations collect data on temperature, humidity, precipitation, and wind speed.
Historical Data:Long-term records of extreme weather events are maintained by national meteorological agencies, such as NOAA, and international organizations like the World Meteorological Organization (WMO).

Satellite and Remote Sensing: Satellites are crucial for monitoring and tracking extreme weather events, including hurricanes, cyclones, and droughts. Instruments like the GOES (Geostationary Operational Environmental Satellite) series provide real-time data on storms and weather patterns.
8. Changes in Precipitation Patterns
Indicator: Climate change affects regional precipitation patterns, leading to more intense rainfall in some areas and droughts in others. This shift can impact water availability, agriculture, and ecosystems.
How it’s measured:
Rain Gauges:Ground-based rain gauges measure rainfall accumulation in specific regions. Data is aggregated over time to assess trends.
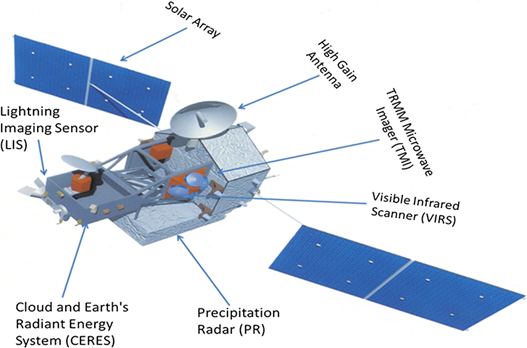
Satellite Data:Satellites also provide precipitation data, especially in areas where ground-based measurements may be sparse. Satellites like the TRMM (Tropical Rainfall Measuring Mission) and GPM (Global Precipitation Measurement) help track rainfall patterns globally.
9. Phenological Changes
Indicator:Climate change can affect the timing of natural events, such as the flowering of plants, the migration of birds, or the breeding seasons of animals. These shifts in timing are referred to as "phenological changes."
How it’s measured:
Ecological Surveys:Scientists track the timing of events such as plant flowering, animal migrations, and insect life cycles through long-term ecological surveys and field studies.
Citizen Science:Programs like Project BudBurst encourage the public to record and report the timing of plant events in their own regions, contributing to broader datasets used to study climate change.
10. Vegetation Changes
Indicator:The changing distribution of plant species, forest growth patterns, and crop yields can be linked to shifts in temperature,rainfall, and other climate factors.
How it’s measured:
Remote Sensing:Satellite imagery and remote sensing technologies are used to monitor vegetation changes over time, including deforestation, forest health, and crop productivity.
Field Studies:Ground-based observations and ecological surveys also provide critical data on vegetation changes in response to shifting climate conditions.
Conclusion
Key indicators of climate change provide crucial information about the ongoing changes in the Earth's climate systems. These indicators, ranging from global temperature rise and carbon dioxide concentrations to ocean warming and extreme weather events, are measured using a variety of tools, including satellites, weather stations, ocean buoys, and ground-based sensors. Collectively, these measurements help scientists understand the pace, scale, and consequences of climate change, and they inform decision-making in terms of mitigation and adaptation strategies.

More in Casino